April 14, 2026
The Liquidity Mismatch in Private Credit: Structural Risks in Non-Traded Vehicles
From Model Marks to Market Reality: Navigating the Liquidity Feedback Loop
By Scott Gordon, Peter Marber, PhD, and Bill Healy
The views expressed are general market observations, provided for informational purposes only, and do not constitute investment advice.
Introduction
Over the past decade, private credit has evolved from a niche financing channel into a central component of the global credit system. As banks retreated from middle-market lending after the Global Financial Crisis (GFC), direct lenders stepped in to finance corporate borrowers across a wide range of sectors. Much of this expansion has occurred through vehicles that combine illiquid assets with periodic investor liquidity, including interval funds, tender-offer funds, and non-traded funds.
These structures operated smoothly during a period of low defaults, stable valuations, and ample refinancing capacity. As conditions become less supportive, however, the interaction between illiquid assets, model-based valuations, and investor redemption terms has drawn increasing scrutiny.
The central issue, therefore, is less private credit than the liquidity terms of the vehicles that hold these illiquid loans.
Executive Summary
- Structural features of private credit vehicles may matter as much as credit quality in stressed markets. Rising redemptions, wider publicly traded Business Development Company (BDC) discounts, tighter financing conditions, and greater valuation scrutiny may intensify the interaction between leverage and liquidity.
- Liquidity stress can accelerate price discovery. Lagged valuations, first-mover redemption incentives, and limited secondary liquidity may amplify market pressure if redemption requests rise (IMF, 2024; Moody’s, 2025).
- Manager selection may become increasingly important. A prolonged period of benign conditions has compressed performance dispersion; as it widens, selection may become more consequential, with investors emphasizing disciplined underwriting, portfolio durability, and controlled growth over scale.
- Dislocations may create attractive entry points. Managers with permanent capital, flexible mandates, and liquidity-provision capabilities may benefit when structurally constrained vehicles become forced sellers.
- Specialized credit strategies may benefit. Emerging market credit, lower-middle-market lending, distressed debt, and special situations could gain from discounted assets, reduced competition, and the development of a deeper private credit secondary market.
Figure 1. Key Market Indicators
| METRIC | LEVEL | SOURCE / CONTEXT | IMPLICATION |
| Avg. BDC / public credit fund discount to NAV | ~20-25% | Public BDC market pricing | Discourages new capital from entering non-traded vehicles at book value |
| Typical private credit fund leverage | ~1.0x debt/equity | Industry estimates (PitchBook / Preqin) | Equity investors absorb first losses |
| Potential bank credit line contraction | Tightening expected | Anecdotal lender commentary / market conditions | Accelerates forced asset sales |
| Interval fund redemption gate | ~5% NAV per quarter | SEC Rule 23c-3 framework | Creates multi-year redemption queues under stress |
| Secondary private credit bid-ask spread | ~10-20 points | Secondary loan market estimates | Reflects illiquidity premium |
I. Build-up to Stress
Leveraged lending has historically moved in cycles—surging during the 1980s LBO boom, retrenching in the early 1990s, expanding again before the GFC, and re-emerging as institutional demand deepened(Goel, 2018).
Legal structures evolved alongside this expansion. BDCs, created in 1980, were designed to channel capital to smaller companies through a closed-end structure (Securities and Exchange Commission, 2006). Interval funds became viable after Rule 23c-3 in 1993 and made periodic repurchases at NAV possible (Securities and Exchange Commission, 1994). Each innovation widened access while introducing new trade-offs between investor convenience and underlying asset liquidity.
The current episode is not entirely novel. Financial markets routinely package economic exposures into income-oriented products for broad distribution. Closed-end fund booms, non-traded REITs, and semi-liquid private credit products differ in detail but share a common feature: the wrapper can become as important as the underlying asset (Investment Company Institute, 2025; Lee et al., 1990).
The post-GFC backdrop accelerated the shift. Higher capital requirements, regulatory scrutiny, and a broader reappraisal of bank balance sheet risk left banks less willing—or less able—to provide certain forms of middle-market credit.
Private lenders stepped into that gap. Figure 2 from the Federal Reserve Bank of St. Louis illustrates the broad transfer: loans to non-financial corporations increasingly moved from bank balance sheets toward non-bank investors. From 2000-2025, the share of all U.S. lending by non-bank investors vs. U.S. banks grew from ~42% to ~72% while overall outstandings more than doubled.
What began as an opportunistic response hardened into a parallel lending ecosystem (International Monetary Fund, 2024; Fama, 2024).
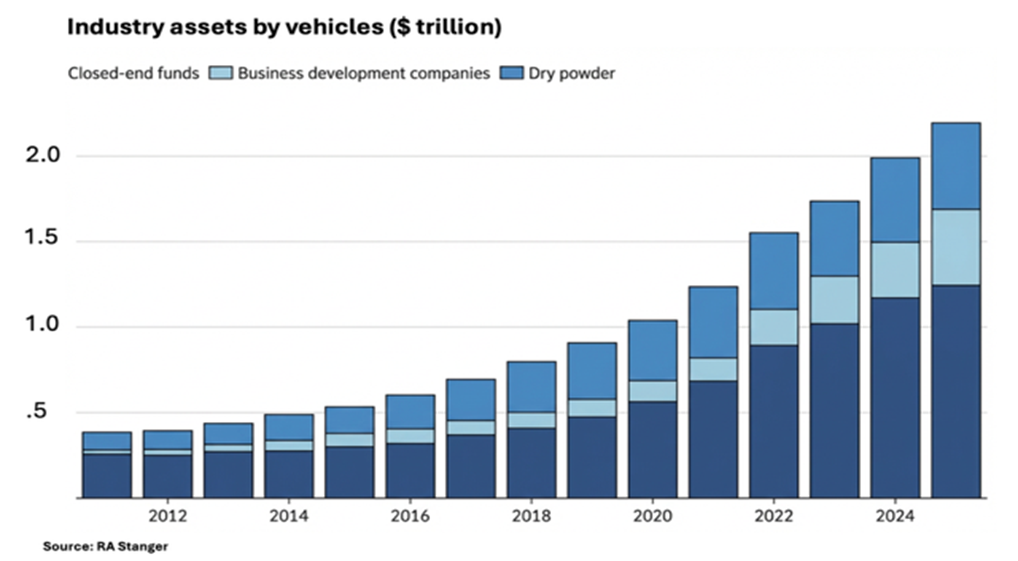
Scale became a key element in the growth narrative around the asset class. As shown in Figure 3, global direct-lending assets rose to more than $2 trillion by 2025. Distributors–-wirehouse platforms, independent broker-dealers, and RIA aggregators-–all helped turn private credit into a retail and wealth-management story. The promise was seductive: equity-like returns with bond-like volatility.
Figure 2. The Recent Explosive Growth in Non-Bank Lending
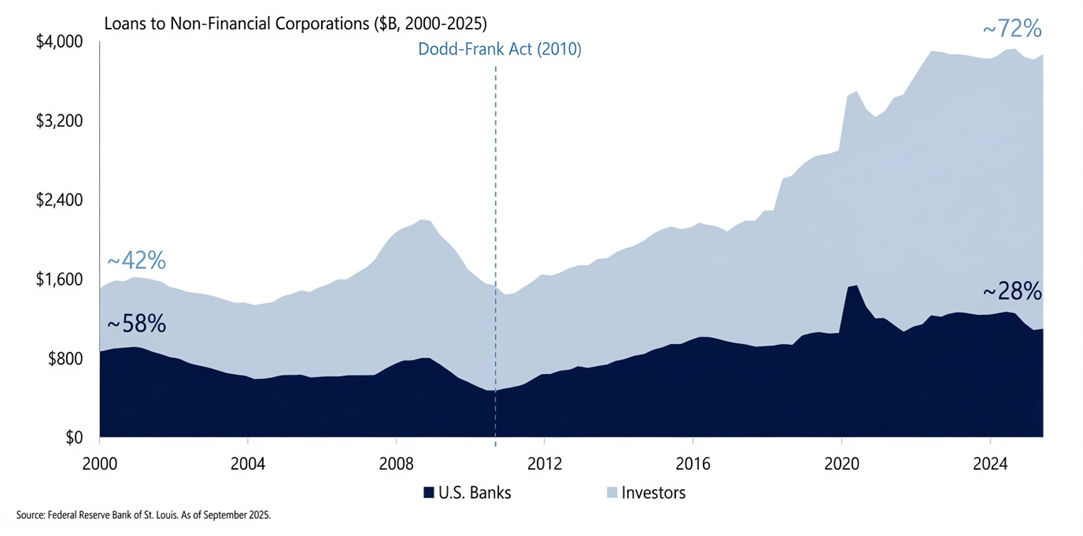
Figure 3. Private Credit Has Grown into a More Than $2 Trillion Asset Class
Some of the ostensible stability reflected valuation practices rather than continuous market pricing. Academic research shows that appraisal-based pricing in illiquid assets produces return smoothing, understating underlying volatility (Geltner, 1993; Ang, 2014).
That dynamic helped pull capital into evergreen funds, interval funds, and concentrated private BDCs because the absence of daily price discovery made risk appear lower than it was. The structure suggested investors could have yield, limited volatility, and some liquidity at the same time—an arrangement that worked while markets remained calm.
Publicly traded BDCs—often the closest liquid proxy for private credit risk—now trade at meaningful discounts to their stated net asset value. That does not mean every private loan is impaired, or that every fund is in trouble; it does suggest that some vehicles may be exposed to a difficult combination of weaker borrowers, fund leverage, and public market selling.
The vulnerability looks especially acute in parts of software and SaaS lending, where underwriting often relies on recurring-revenue multiples and the assumption of easy refinancing. BIS research suggests SaaS exposure grew from roughly $8 billion in 2015 to more than $500 billion by 2025—about 19% of total direct loans—while Reuters reports that Payment‑in‑Kind (PIK) Interest options became much more common in software deals over the same period (Doerr et al., 2026; Tracy, 2026).
They can trade materially below par if growth slows, refinancing becomes difficult, and valuations adjust.
II. Liquidity, Leverage, and Forced Price Discovery
The current stress reflects a structural mismatch between illiquid loans and the liquidity terms offered by the vehicles that hold them. Direct loans are negotiated, bespoke, and difficult to sell quickly at carrying value. The vehicles, by contrast, offer different liquidity terms. Listed BDCs offer daily liquidity through the stock market; non-traded BDCs and interval funds offer periodic repurchases at NAV; drawdown funds largely avoid interim liquidity promises altogether (Investment Company Institute, 2025; Basak et al., 2026). Investors often treat these structures as similar, but under stress they behave very differently.
Figure 4. Investment Vehicles and Liquidity Provisions
| VEHICLE | LIQUIDITY TO INVESTOR | HOW PRICE IS SET | LIKELY STRESS EXPRESSION |
| Listed BDCs / traditional closed-end funds | Daily via exchange trading | Market price; can trade at a discount or premium to NAV | Immediate price discovery: discounts can widen sharply |
| Non-traded BDCs | Periodic repurchases, typically quarterly | Repurchase at NAV, subject to program limits | Gates, pro-rata exits, and multi-quarter queues |
| Interval funds | Rule 23c-3 repurchases, usually quarterly | Repurchase at NAV within stated offer range | Oversubscribed tender windows and rationed liquidity |
| Drawdown institutional private credit funds | Little or no interim redemption | Capital returned through realizations and repayments | Less convenient, but a better match between assets and liabilities |
Listed BDCs provide transparent price discovery—though sometimes volatile—as exchange-traded entities; investors can enter or exit at will, subject to secondary trading volumes and price movements relative to net asset value.
Semi-liquid vehicles manage liquidity differently. They try to preserve portfolio marks by limiting exits through tender offers, repurchase windows, and gates. Drawdown funds are least convenient, but also least ambiguous. They do not provide interim liquidity to investors.
The weakness of the semi-liquid model lies in the combination of illiquidity and lagged valuation. When investors suspect that model-based marks no longer reflect realizable prices, a first-mover incentive emerges. The rational impulse is to tender at the next opportunity—before financing tightens, before markdowns catch up, and before redemption queues lengthen. The IMF has warned explicitly that stale valuations can create this sort of first-mover advantage in private credit funds (International Monetary Fund, 2024). At that point the problem is no longer only about borrower performance. It becomes an accelerated and self-reinforcing redemption cycle.
Fund leverage amplifies this dynamic. Many private credit funds deploy leverage near 1x equity to enhance returns. Assets are continuously subject to competing claims from borrowers, fund lenders, and investors; as redemptions accelerate and inflows reverse, those demands become procyclical, tightening liquidity. If banks reduce credit availability or unsecured funding costs rise, deleveraging becomes unavoidable—forcing price discovery.
Figure 5. The Private Credit Liquidity Feedback Loop
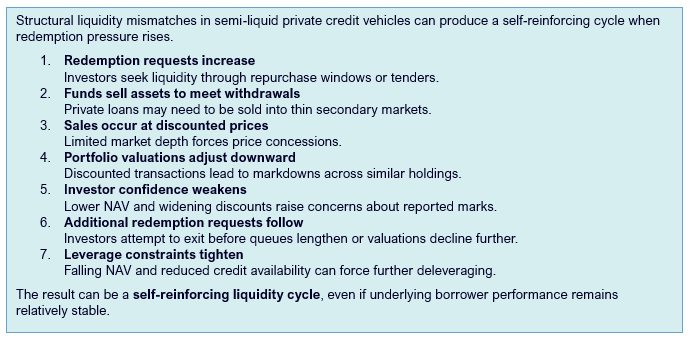
In public high-yield and the bank syndicated loan markets, prices may be stressed, but they are visible. In private credit, a forced seller often discovers the market only when it must transact. That matters because the secondary market remains relatively shallow. Sales undertaken to meet withdrawals, repay credit lines, or satisfy asset-coverage tests may clear at discounts that immediately undermine neighboring marks.
Variants of the same mechanism appeared in 2008-2009, when banks and CLO warehouses sold leveraged loans at sharp discounts despite relatively modest ultimate losses. European bank deleveraging later created similar opportunities in performing loans that had simply been sold by institutions under pressure. In both cases, liquidity constraints did a great deal of the pricing work.
A private-credit fund does not need universal borrower failure to face a crisis of confidence. It needs only enough doubt, enough leverage, and enough requests for cash.
III. The Emerging Redemption Cycle
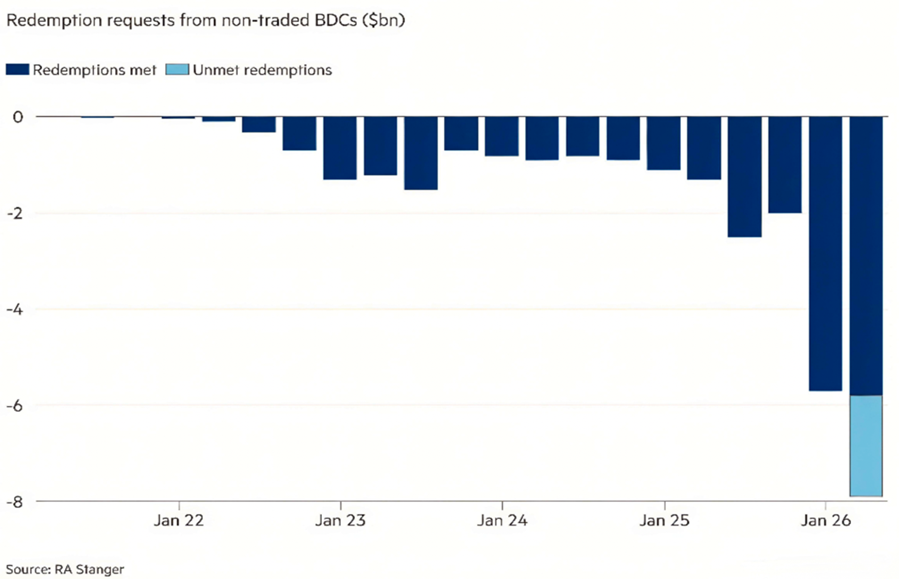
Redemption notices appeared as early as January 2026, before the latest headlines about private credit stress. Figure 6 illustrates how sharply withdrawal requests have increased.
Figure 6. Private Credit Fund Withdrawals
Existing investors face a clear first-mover incentive: redeem while repurchase windows remain open rather than risk joining a growing queue of tender requests.
At the same time, new investors have little incentive to subscribe to the reported NAV when public credit vehicles trade at meaningful discounts and offer daily liquidity. The stabilizing effect of new inflows therefore weakens just as redemption requests rise.
A manageable redemption queue can quickly become a multi-quarter problem when exit demand exceeds a fund’s scheduled repurchase capacity. What begins as periodic liquidity may therefore evolve into a prolonged redemption cycle in which investors compete for limited exit windows.
IV. Investor Outcomes Under Redemption Pressure
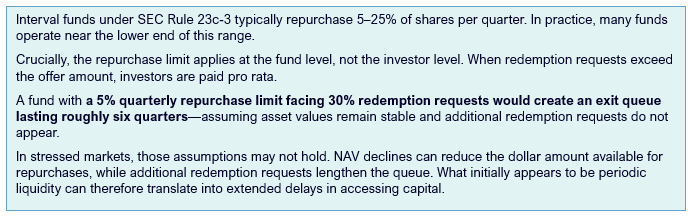
For investors, the effects tend to be gradual rather than sudden. The first risk is markdowns. Forced sales and more conservative marks can reduce NAV even if underlying loans eventually recover value over time. The second is liquidity delay: capital may remain tied up longer than expected, as managers slow realizations, extend assets, or ration repurchases. The third is structural subordination within the fund’s capital structure. Interval funds make the mechanics plain. The SEC Rule 23c-3 allows repurchases of 5% to 25% of outstanding shares per offer, typically quarterly.
Non-traded BDCs present a similar problem. Unlike exchange-traded closed-end funds, they do not provide a market-clearing exit route at whatever discount the market demands. Investors are dependent on the fund’s repurchase program or on distressed secondary buyers. That is a more limited exit channel than many investors may have anticipated. “Periodic liquidity” was technically true, but it could also be more limited in practice than many investors expected.
Figure 7. How Redemption Queues Form in Interval Funds
The loss waterfall is also important. In levered funds, banks and fund-level creditors typically hold secured, senior claims, leaving equity investors to absorb the first losses. The residual risk sits with fund shareholders, who can suffer both delayed liquidity and lower exit values.
The question is not whether investors expected low volatility and periodic liquidity—many did—but whether the structures can deliver those expectations once conditions change. The question is whether the instrument could deliver on those promises once the cycle turned. Increasingly, the evidence suggests that some may struggle to do so.
It is important to remember that not every vehicle is exposed. Structures with permanent or evergreen capital, limited reliance on retail distribution, flexible mandates, and a focus on senior secured claims are better positioned to act as liquidity providers rather than liquidity takers. In a redemption-driven cycle, that distinction is decisive. Managers that do not need to meet withdrawals can buy when others sell, negotiate from strength, and capture discounts created by structural mismatches elsewhere in the market. In that sense, the best defense is not merely good underwriting. It is liability structure.
V. Market Implications of a Private Credit Liquidity Adjustment
A liquidity adjustment in private credit could affect asset managers, funding markets, and borrowers through several channels.
First, asset-manager valuations may compress. Fee streams tied to private-credit AUM command premium multiples only so long as investors believe those AUM figures are stable, sticky, and economically meaningful. When fundraising slows, repurchases rise, and confidence in reported valuations weakens; the market typically pays less for that annuity. Managers reliant on distribution-driven fundraising may be most exposed.
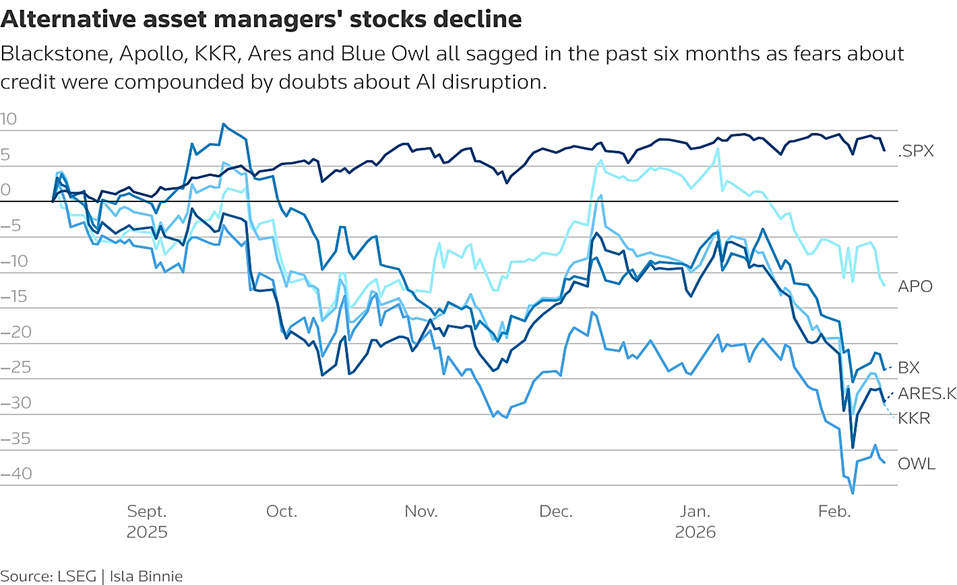
Figure 8 illustrates how quickly listed alternative managers can re-rate when investors decide that growth prospects are less certain than previously assumed.
Figure 8. Falling Alternative Asset Manager Multiples
Second, stress should accelerate consolidation. The analogue is the post-crisis CLO market, where a crowded field of smaller managers lost mandates, failed to issue new vehicles, or sold themselves to larger firms after 2008-2009. Scale mattered because warehousing assets, navigating liability structures, and maintaining investor confidence required balance sheet strength. Private credit today contains similar ingredients: many managers born in a benign cycle, heavy concentration in one strategy, and a tougher fundraising backdrop. The most diversified platforms should gain share; weaker or narrower managers may discover that scale may prove increasingly important.
Third, some strains may spill into public credit. The transmission mechanism is not necessarily fire sales of identical assets into liquid markets; it is refinancing. Borrowers that once expected private lenders to refinance them may instead arrive in syndicated loans or high-yield markets at the wrong moment. Sponsors facing pressure at portfolio companies may pursue liability-management transactions or recapitalizations that effectively push risk outward. If leveraged-loan conditions also deteriorate, the result could be wider credit spreads and tighter funding conditions for lower-quality borrowers.
Fourth, the cycle is likely to change who gets trusted. During the expansion, scale itself often looked like a virtue: more assets under management, broader distribution, and faster product formation. In the recovery, allocators may prefer managers who grew more slowly, kept underwriting discipline, and avoided stretching for asset growth. That shift would not punish size as such; it would reward managers that maintain underwriting discipline.
Fifth, periods of dislocation may create opportunities across specialized credit strategies. Emerging-markets credit may reprice to wider yields relative to domestic alternatives. Lower-middle-market and non-sponsor direct lending could become more attractive if reduced competition restores lender protections and pricing discipline. Distressed debt and special situations almost by definition benefit when forced sellers need someone else’s balance sheet. Most importantly, a deeper secondary market in private credit may begin to develop.
Key Implication: The Emergence of a Secondary Market in Private Credit
One of the most consequential outcomes of a private-credit liquidity adjustment may be the development of a deeper secondary market. Unlike earlier credit dislocations, where most distressed trading occurred in syndicated loans and high-yield bonds, the present cycle may see increased activity in direct-lending portfolios, fund interests, and stakes in semi-liquid vehicles sold by investors seeking liquidity sooner than the structure can provide it.
The ingredients for attractive returns are familiar: motivated sellers, high information asymmetry, and a gap between transaction prices and longer-term recovery values. Assets purchased at significant discounts to par may offer compelling value if underlying credit quality proves durable over time.
History offers a guide. After the GFC, banks sold performing corporate loans at steep discounts as they repaired balance sheets. European bank deleveraging produced a second wave of opportunities. CLO warehouses, too, have periodically been liquidated not because the assets were hopeless, but because the financing or timing no longer worked. In each case, specialist buyers with analytical depth and patient capital were able to buy future normality at stressed pricing.
Preparation, therefore, becomes important. The bottleneck in secondary private credit is unlikely to be deal flow. It will be analytical capacity, capital availability, and the willingness to buy when reported marks are still adjusting. Managers building those capabilities through dedicated funds, separately managed accounts, or flexible opportunistic mandates, may be among the main beneficiaries of the next phase.
VI. Institutionalization of Private Credit
Stress in semi-liquid wealth products does not necessarily imply that private credit itself is structurally impaired. The longer-term trend still points toward institutionalization. McKinsey reported in 2025 that 43% of surveyed limited partners planned to increase private-debt allocations over the following year according to survey responses; Mercer found similar intentions among large asset owners; Natixis reported broad institutional optimism about the expanding investable universe; and NEPC documented the sharp growth of institutional direct-lending drawdown funds over the prior decade (McKinsey & Company, 2025; Mercer, 2025; Natixis Investment Managers, 2025; Lavin, 2025).
Asset classes often mature in stages: first filling a financing gap, then gaining formal benchmarks and policy allocations. Cambridge Associates has argued for some time that private credit is underused, and NACUBO-TIAA began reporting private debt as a standalone category in 2019 (Perez, 2021). Public pensions have also been major allocators.
One possible historical analogy is the development of private equity several decades ago: a once-specialized strategy that gradually became an institutional routine. Semi-liquid retail wrappers may complicate that path, but they do not necessarily reverse it. If anything, this episode may accelerate a useful separation between products designed for ease of distribution and structures designed for the asset itself.
One possible long-run outcome is a bifurcation rather than a retreat: stronger institutional drawdown funds and permanent-capital vehicles on one side, more scrutiny of semi-liquid wealth products on the other. That would be an uncomfortable adjustment for some managers, but potentially a constructive development for the asset class.
VII. Conclusion
For much of the past decade, stable credit conditions and ample refinancing allowed these structures to operate with little friction. When those conditions weaken, the mismatch between illiquid assets and investor liquidity becomes more visible.
For investors, this makes transparency around the structure as important as credit analysis. Understanding how valuations are determined, how leverage is financed, how repurchase mechanisms operate, and how funds manage redemption pressure may be critical considerations during periods of market stress. The resilience of a private credit investment may depend as much on vehicle design as on the performance of the underlying borrowers.
Periods of market stress may also create dislocations and opportunities. If redemption pressure forces asset sales into thin secondary markets, pricing may reset to levels that more fully reflect illiquidity and credit risk. Strategies with flexible or patient capital, including emerging-market credit, lower-middle-market lending, and distressed or special situations investing, may see increased activity if competition recedes and pricing discipline returns.
Private credit itself does not appear likely to retreat from its role in corporate finance. But the next phase of the cycle may reshape how investors evaluate the vehicles built around it.
The asset class may endure, even if some of the structures surrounding it do not.
About the Authors
Scott Gordon – Partner, Chicago Atlantic; Executive Chairman & CIO, Chicago Atlantic BDC Inc. (NASDAQ: LIEN)
Peter Marber, PhD – Co-Head of Emerging Markets, Chicago Atlantic
Bill Healy – Partner, Capital Formation, Chicago Atlantic
Collectively, the authors bring more than 120 years of experience across global credit markets, spanning trading, investing, and institutional capital formation. Each began their careers in the mid-1980s, during the early development of the emerging markets debt industry and have since worked together at various points across leading financial institutions and investment platforms.
Across multiple credit cycles—from early emerging markets debt to the modern expansion of private credit—the authors have navigated periods of market stress and structural change firsthand. The perspectives in this paper reflect that practitioner experience, particularly as it relates to evolving liquidity dynamics.
Important Information
This material is provided for informational and educational purposes only. It does not constitute investment advice, a recommendation, or an offer to buy or sell any security or investment strategy. The analysis reflects general market observations and historical patterns and should not be relied upon as a prediction of future outcomes.
Sources