May 18, 2026
Please Don’t Let Me Be Misunderstood: The Maturation of Emerging Markets Credit
Q2 2026
By Jim Garvey, CFA, Umesh Mahajan, Scott Gordon, Peter Marber, PhD, FRSA, FRAS
The views expressed are general market observations, provided for informational purposes only, and do not constitute investment advice.
Emerging Markets credit – debt obligations of borrowers from Africa, Asia, developing Europe, Latin America, and the Middle East – is still too often described as if it were a small, volatile corner of global fixed income.
That view is outdated.
A Growing Universe
Today’s Emerging Markets debt universe is large, liquid in many segments, increasingly diversified, and no longer confined to a handful of dollar-denominated sovereign bonds. JP Morgan estimates that the total Emerging Markets debt market hit US$31 trillion in 3Q 2025, or 28% of the total global bond market, up from only 2% in 2000.1
This scale is important because it changes how the asset class should be viewed. Emerging Markets credit is not a single trade. First, issuers range from AAA borrowers in countries like Singapore to serial defaulters; in countries where GDP per capita ranges from below $1,000 to over $50,000.
Secondly, it is a diverse universe across hard-currency sovereign debt, hard-currency corporate debt, local-currency sovereign debt, local-currency corporate lending, bank loans, trade finance, infrastructure debt, and private credit. Major benchmarked bond segments alone are roughly US$1.8 trillion of hard-currency sovereign debt, US$2.6 trillion of hard-currency corporate debt, and US$15.6 trillion of local-currency sovereign debt.
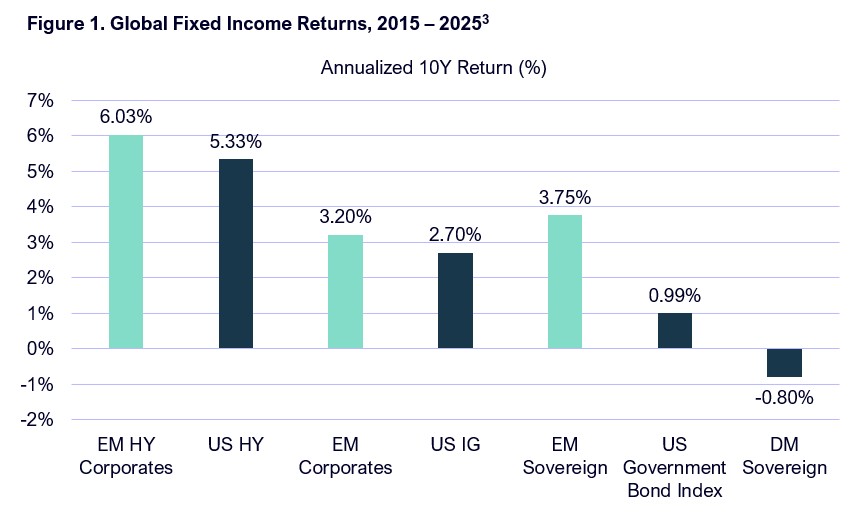
As shown in Figure 1, Emerging Markets index returns have also been noteworthy, outperforming broad bond benchmarks for the last decade.2
But the public market is only the visible layer of EM debt. Behind it sits a much larger financing need across companies, infrastructure platforms, exporters, financial institutions, and mid-sized businesses that are too small, too local, or too bespoke for the bond market. That is where Emerging Markets private credit becomes relevant.
Direct lending in these countries totals approximately $4 trillion – interestingly, the same size as the U.S. market. The difference is in the composition of lenders: in the U.S., approximately 28% comes from banks and a remarkable 72% from non-bank lenders.4 In Emerging Markets, banks still dominate with 97% of outstandings, with less than3% coming from non-bank lenders.5
The International Monetary Fund estimates that Emerging Markets private credit assets under management have increased fivefold over the past decade; however, they still stand at less than US$100 billion. In other words, EM private credit is growing quickly, but it remains tiny relative to both the public EM credit universe and the financing needs of emerging economies.
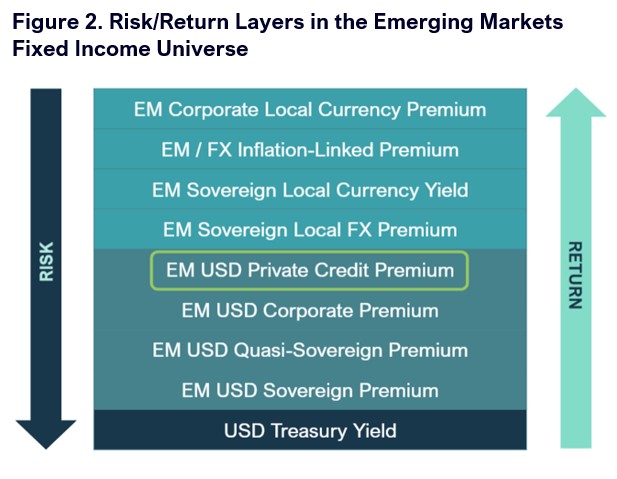
In addition, there is a potential to earn excess risk premia (see Figure 2) while still investing in the less volatile USD currency debt versus local currency instruments. This highlights an interesting opportunity for skilled managers in the private credit arena.
Why The Confusion?
One common problem is that investors often conflate “Emerging Markets” with “low quality.” The reality is more nuanced. Emerging Markets debt has matured dramatically since the Brady Bond era.6 Indeed, the universe has grown as capital markets developed, liquidity improved, and credit quality rose. Institutional investors such as pensions and endowments are now common investors.
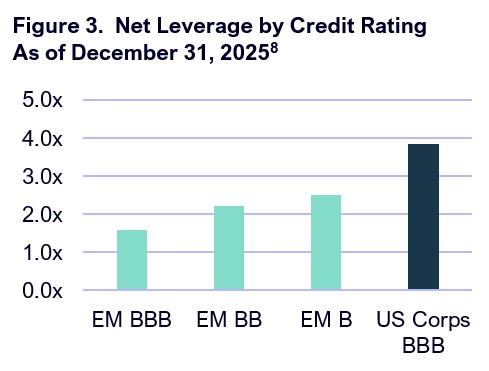
Another misconception is that Emerging Markets credit is assumed to be uniformly risky. It is not. Some EM borrowers are fragile and should be avoided. Others are systemically important banks, export champions, infrastructure operators, energy companies, or sovereigns with stronger balance sheets than many developed-market peers. EM corporates have often taken a more financially conservative approach than developed-market peers, with investment-grade EM corporate net leverage falling to around 1.0x in 2024 from more than 1.5x in 2013.7
Moreover, EM corporates are often “ratings constrained” by their home sovereigns, creating the possibility of structural underrating where the company is stronger than the country rating suggests. That is, a strong balance sheet company that would likely get an A-rating in the U.S. would, unfortunately, be rated no higher than BB if based in a BB-rated country. This creates interesting investment opportunities for investors capable of fundamental country and company analysis.
Growth AND Value
Most investors know about the EM growth story, but fewer understand the value opportunity in these countries. The strongest evidence that perception and reality have diverged comes from the Global Emerging Markets Risk Database, or GEMs. The GEMs Consortium was co-founded by the International Finance Corporation and the European Investment Bank to pool credit risk data on 10,000 loans from multilateral development banks and development finance institutions. From 1994 to 20249:
• private counterparties posted an overall default rate of 3.56% and average recovery rates of 72.2%;
• public counterparties had a default rate of 2.59% and recovery rates of 85.9%.
For comparison, Moody’s Global Loans reported 70% recovery rates, and 59% for Moody’s Global Bonds.9 The data appears to challenge the prevailing risk perceptions, suggesting the EM recovery rates for private and public counterparties exceed several global benchmarks.
That does not mean EM credit is low risk. It means the risk is often poorly understood, overgeneralized, and therefore sometimes mispriced. That distinction matters. Emerging markets credit is not attractive because it is safe in a simplistic sense. It is attractive because the market frequently pays investors a premium for perceived complexity, geography, liquidity, politics, and currency — even when the underlying credit risk is more manageable than headlines suggest.
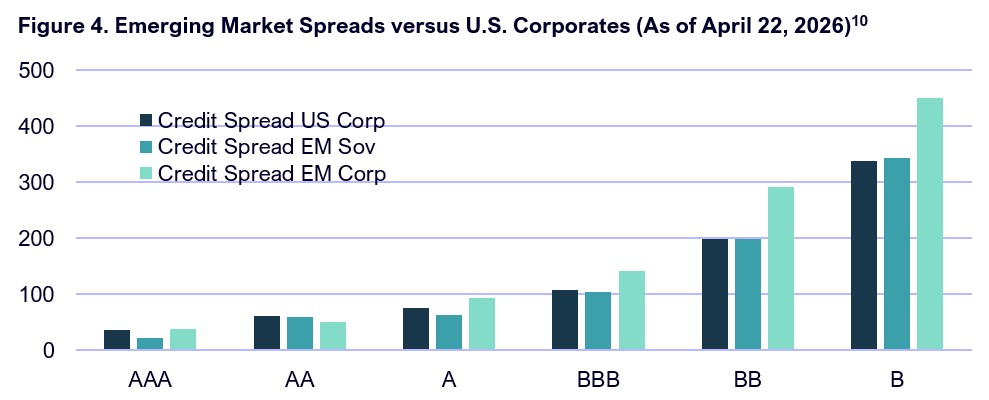
This is where the “value” argument begins. EM credit can offer higher yields than similarly rated developed-market credit, shorter duration in parts of the corporate universe, and compensation for risks that can be analyzed rather than blindly avoided. ICE/BofA’s May 2026 data showed hard-currency sovereign investment-grade EM debt yielding 6.00%, hard-currency corporate investment-grade EM debt yielding 5.77%, and the U.S. investment-grade corporate debt yielding 5.14%. That spread is not free money, but it is a real valuation advantage across the rating spectrum when paired with disciplined underwriting.
The “growth” and “value” arguments are distinct and equally relevant. Value comes from what the market misunderstands today; growth comes from where capital is needed tomorrow.
Emerging Markets need substantial financing over the next several decades for energy, logistics, housing, digital infrastructure, trade, health care, manufacturing, and financial inclusion. Public capital markets can serve large repeat issuers, but they do not efficiently serve the long tail of EM borrowers. Private credit can fill that gap through senior secured loans, asset-backed lending, trade finance, infrastructure credit, receivables finance, and bespoke corporate lending.
This is why EM private credit is not merely an extension of U.S. direct lending. In the U.S., private credit has become crowded, heavily intermediated, and increasingly exposed to questions around leverage, valuation, and liquidity. It is dominated by a few large players who often invest in others’ deals, offering investors less diversification than they might believe. The recent negative headlines on U.S. credit also highlight a key difference: in the U.S., illiquid loans are sometimes placed inside structures with periodic redemption features and fund-level leverage, creating a mismatch between investor liquidity expectations and underlying asset liquidity. This liquidity feature is one reason investors have flocked to non-bank private lending vehicles in recent years. That is a real risk — but it is a vehicle-design risk, not an argument against private credit itself. It certainly does not characterize EM private credit, which is less than 5% the size of the U.S. equivalents.
In Emerging Markets, the opportunity should be approached differently. First, picking the right countries is paramount to solid returns; the best company operating in a country with bad fundamentals can often lead to big losses. Second, the most attractive EM private credit strategies are not built around pretending that illiquid assets are liquid. They are built around matching long-term capital with long-term lending, negotiating covenants, taking collateral, structuring amortization, controlling cash flows, and underwriting currency, legal, and political risks from the start. Transparency and data gaps must be managed carefully.
Clear Eyes
For investors with eyes wide open, EM private credit – done properly – can offer both value and growth. The value comes from scarcity of capital, negotiated documentation, collateral, structural protections, and a risk premium that reflects complexity. The growth comes from lending into economies and businesses where credit is not merely refinancing financial engineering, but funding productive capacity, where excess returns can be compounded. Remember, Emerging Markets continue to show stronger real GDP growth prospects versus developed markets and now contribute more than half of all global growth.
The conclusion is straightforward. Emerging markets credit is too large to ignore, too diverse to summarize with a single risk label, and too inefficient to approach passively. Private credit adds a second layer: a smaller, faster-growing, less crowded market where capital scarcity can translate into stronger lender protections, more floating-rate protection, and attractive risk-adjusted returns. The asset class is misunderstood because investors often see only volatility, politics, and geography. The better lens is through diligent underwriting. For investors willing to do the credit work and willing to provide patient, structured capital – Emerging Markets uniquely offers compelling value in some of the world’s most dynamic growth economies.
Sources:
1 – State Street Investment Management, “Emerging market debt 101,” Insights, Q3 2025
2 – Past performance is not indicative of future results. Indices are unmanaged and not directly investable.
3 – MSCI, JP Morgan, as of May 1, 2026. Please refer to the Benchmarks disclosure at the end of this material
4 – Federal Reserve Bank of St. Louis, September 2025
5 – International Monetary Fund, Global financial stability report, April 2024, Chapter 2: The rise and risks of private credit.
6 – Brady Bonds are debt securities issued by certain emerging market sovereigns, typically as part of debt restructuring arrangements. They are generally collateralized by U.S. Treasury securities and may carry features such as fixed or floating interest rates, partial guarantees of principal or interest, and long maturities. Investments in Brady Bonds are subject to risks associated with the creditworthiness of the issuing country, political and economic conditions in emerging markets, interest rate fluctuations, and potential limitations on liquidity.
7 – Goldman Sachs Asset Management, Rising the Tide: The Strengthening Case for Emerging Markets Debt, 2025.
8 – J.P. Morgan, Bloomberg Finance L.P., Capital IQ. Excludes 100%-quasi-sovereigns, financials, real estate, and defaulted companies.
9 – Global Emerging Markets Risk Database, Default and Recovery Statistics, Public and Private Lending 1994 – 2024
10 – J.P. Morgan